U.S. & Global
Stock Market
Professional-grade analytics to power your investment decisions.
Get StartedKey Features
Powerful research, made simple.
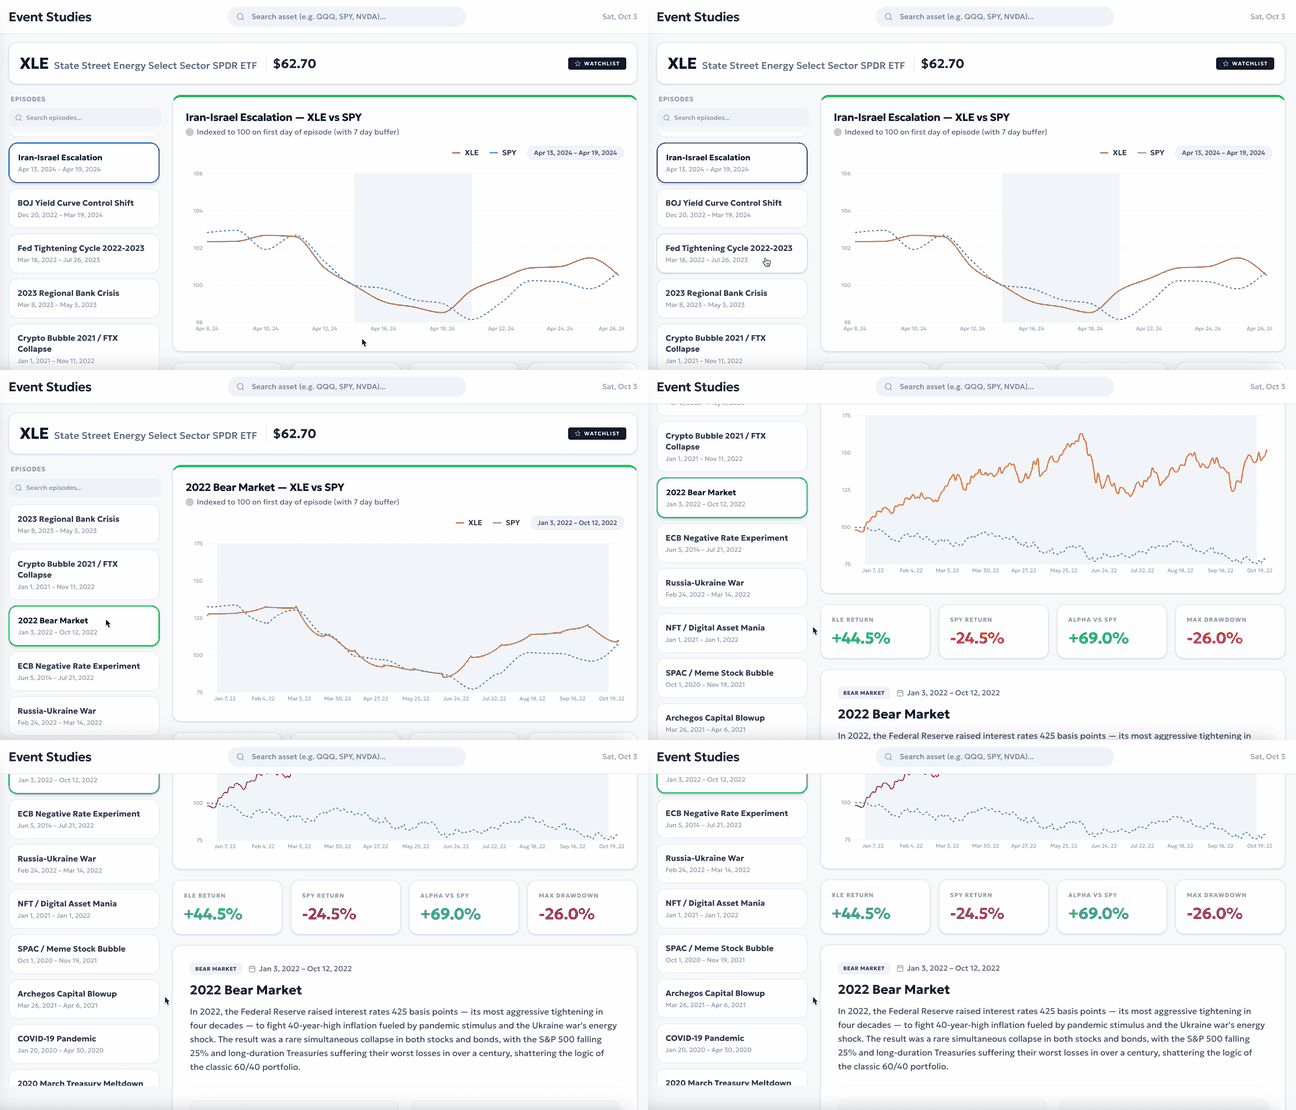
Tactical Portfolio Models
Systematic portfolio guidance for every market condition
Our dynamic model reads market conditions and updates its suggested allocation, so you can manage risk in downturns and stay positioned for upside.
Daily Performance Tracking
Track model performance against the S&P 500 using risk-adjusted metrics, and cumulative return charts, updated daily.
Market Shift Detection
Our engines detect shifts in market behavior and signal allocation changes across momentum leaders, risk hedges, and defensive cash.
Full Portfolio Transparency
No black boxes. See every holding, every allocation, and every change the model has made.
Powerful Equity Screener
Filter thousands of U.S. stocks in seconds
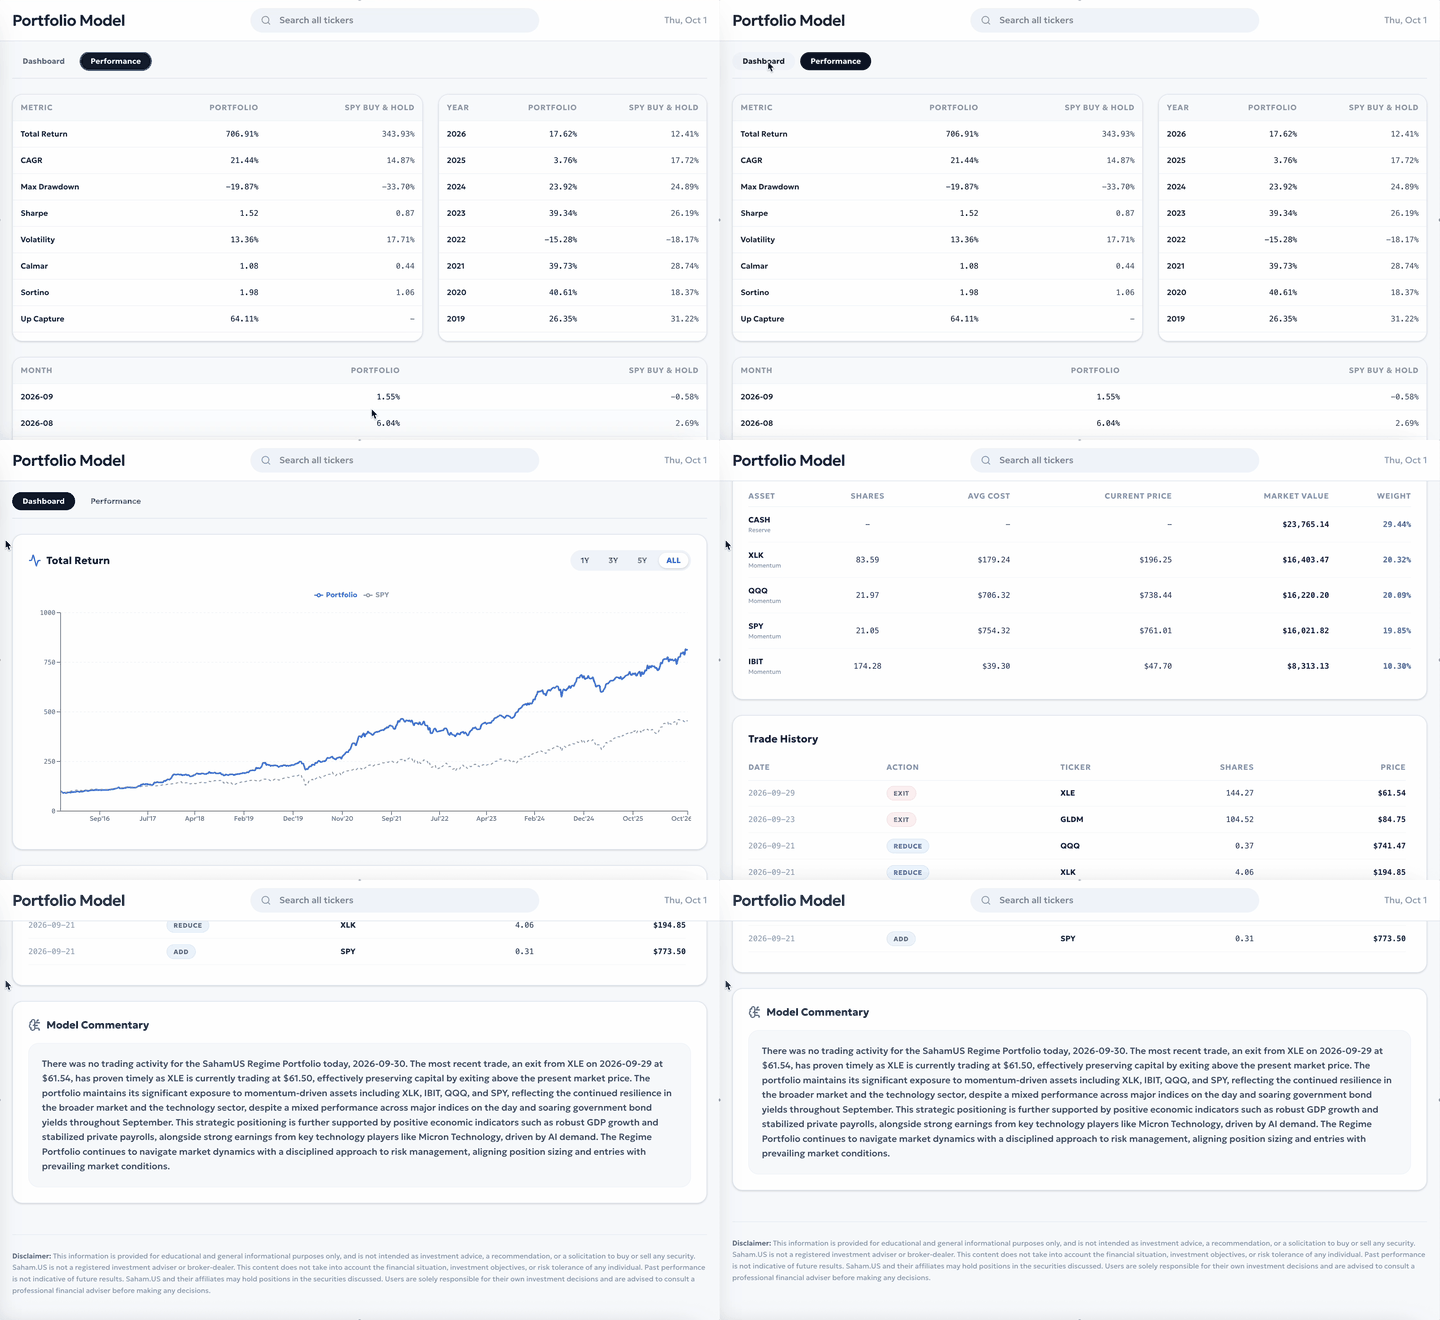
Build custom screens that combine any of 300+ metrics, from valuation and growth to technicals and volatilities.
Rare Metrics Included
Screen on fundamentals and technicals, including the rare ones such as Shareholders Yield, Deferred Revenue, Next 5 Years Estimates, Maximum Drawdown, Total Return, and much more.
Flexible Rule Builder
Combine conditions with AND/OR groups, nested as deep as you need. Results update instantly in your browser.
One-Click Watchlist Sync
Save your screens as templates and send the resulting stocks straight to your watchlist.
Market Behavior Monitor
See how markets are behaving across 90+ global assets
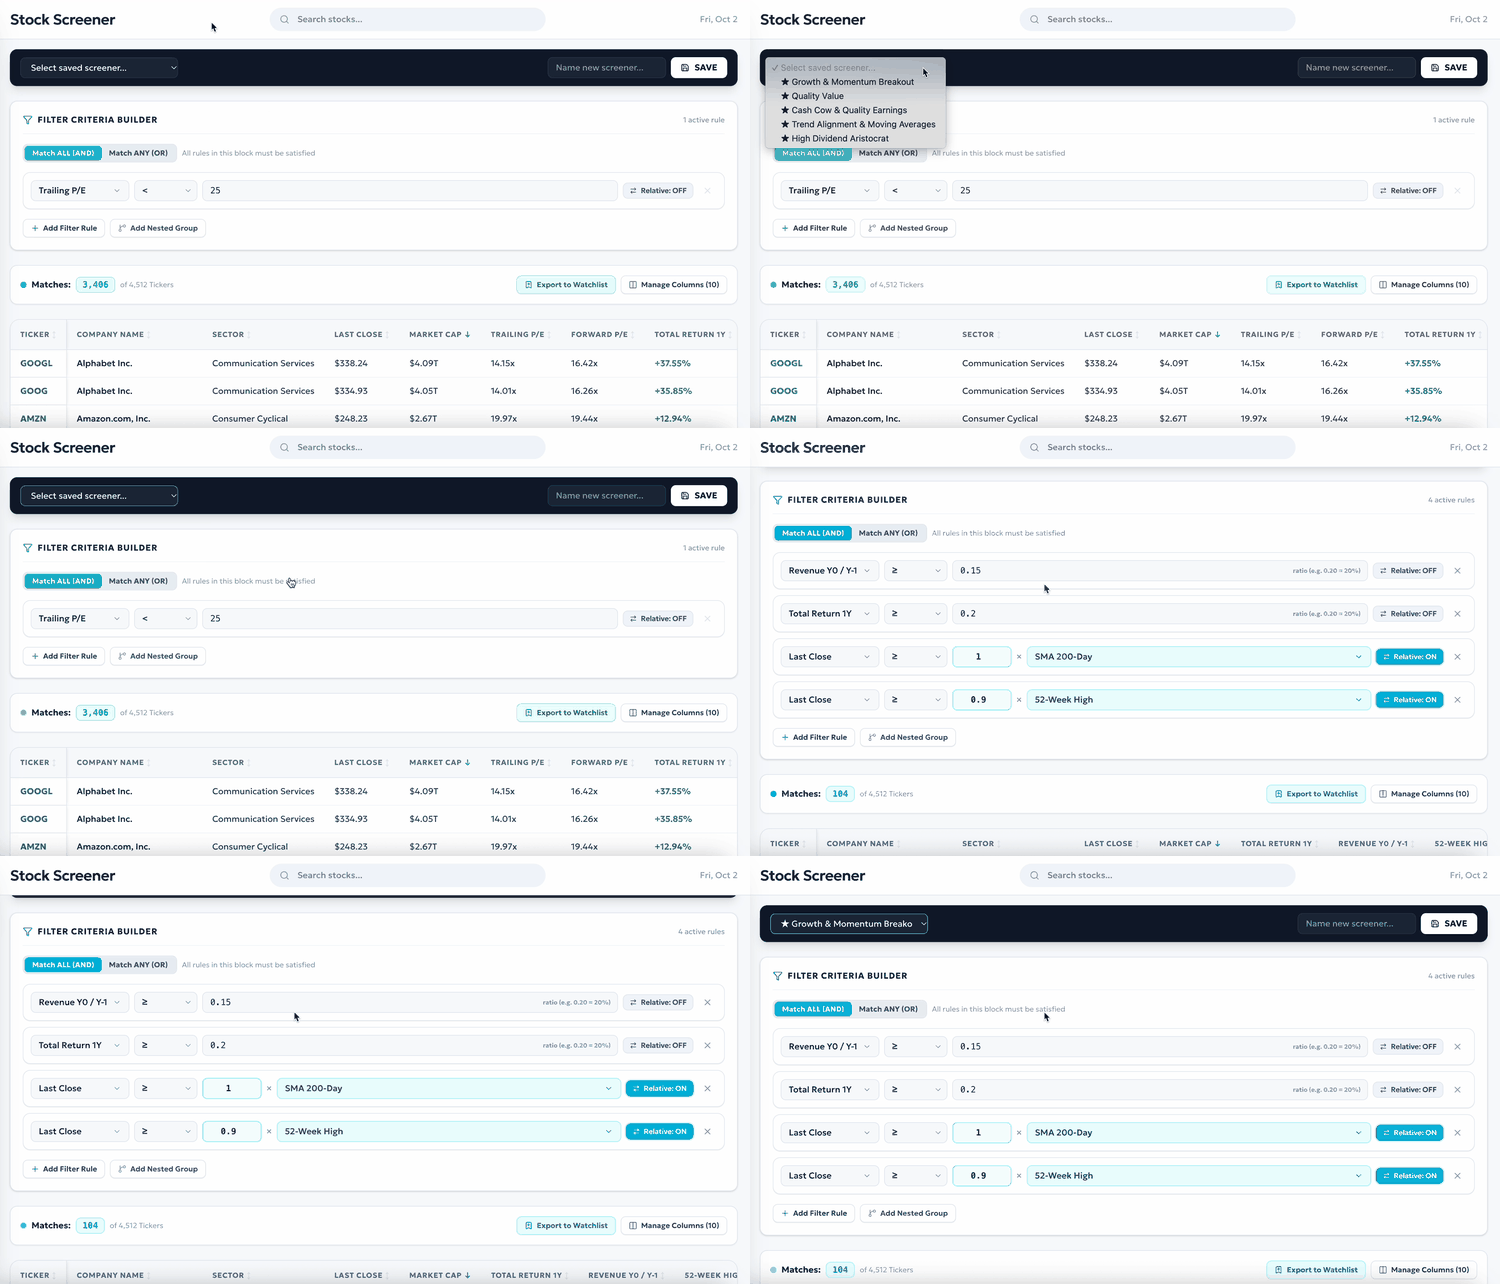
Get a quick read on the overall state of the market. Behavior is sorted into five stages: Euphoria, Optimism, Complacency, Anxiety, and Despair. Stages are based on price and volatility data, not opinion polls or news.
Five Stages of Market Behavior
Spot signs a trend is running out of steam, and possible turning points, often earlier than traditional lagging indicators.
Drill Down Across Assets
See which stage each market is in, from major indices and all 11 S&P sectors to industry groups, bonds, commodities, and crypto.
5-Day Trend History
See how market behavior has shifted over the past five days, to help tell short-term pullbacks from longer-lasting reversals.
Event Studies
See how any instruments reacted to past events
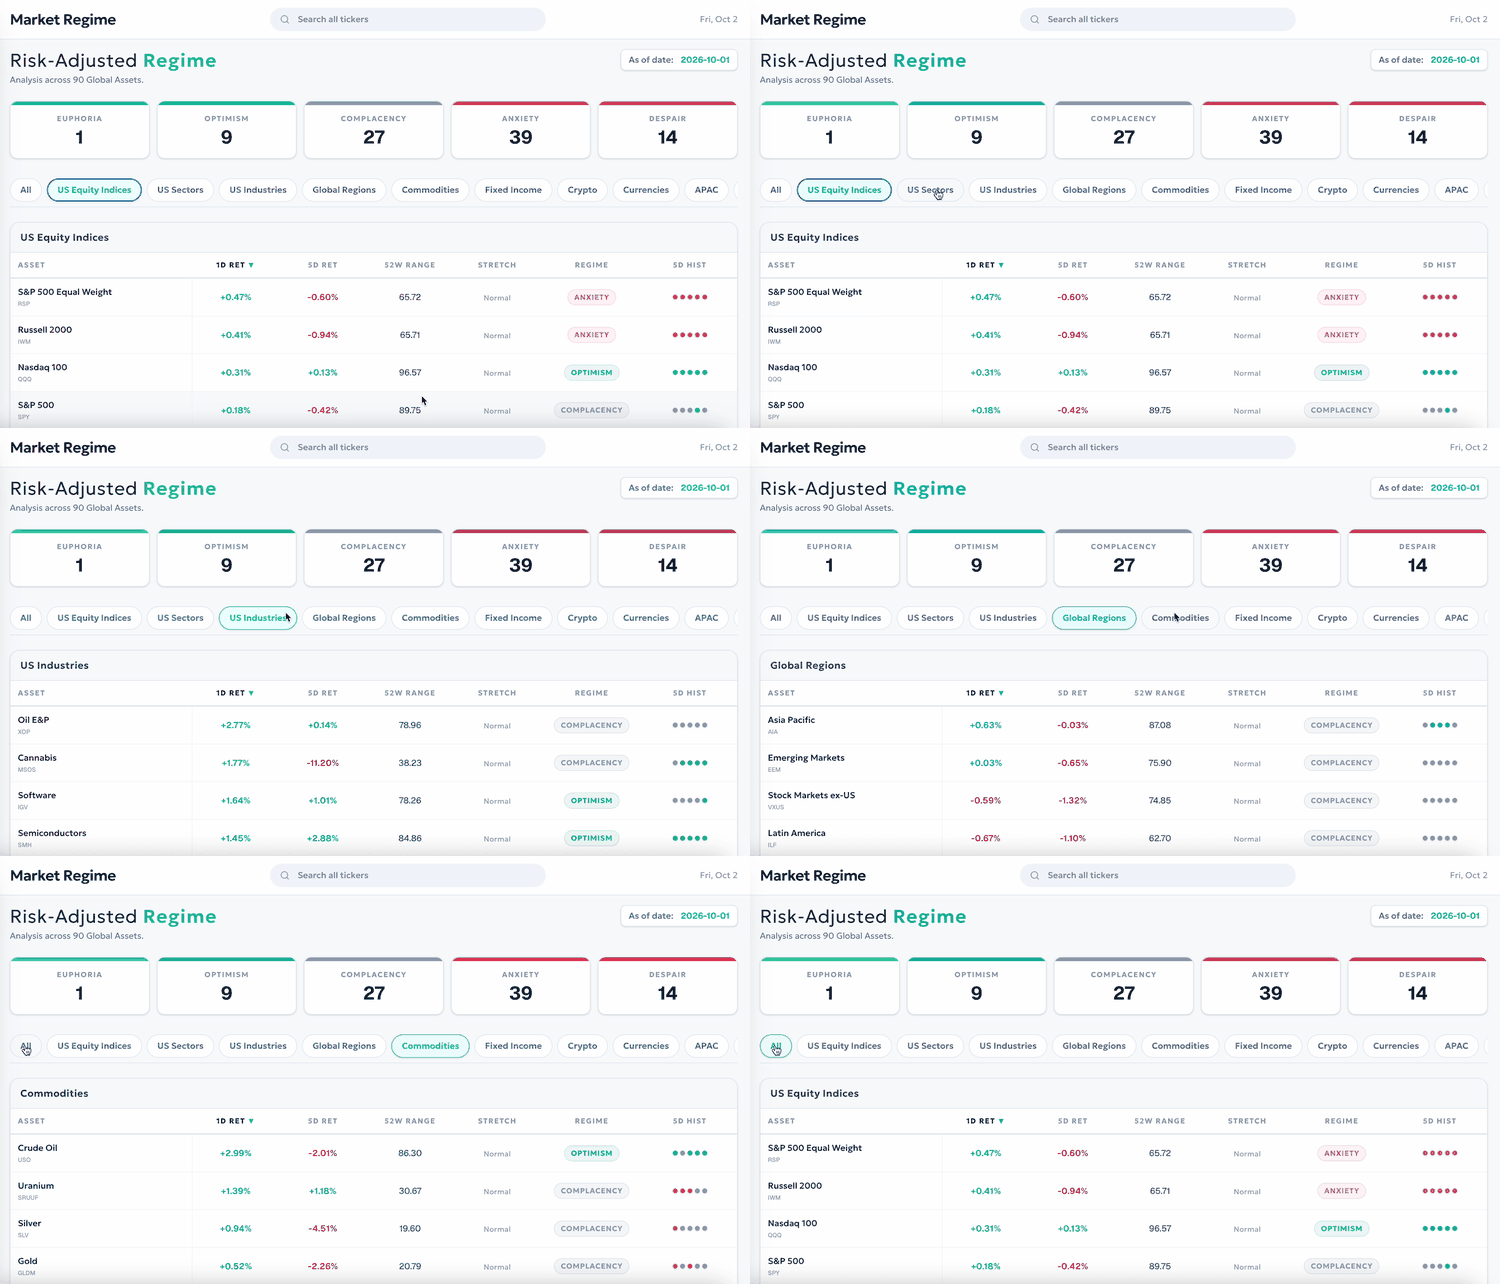
Look back at major market volatilities and see how any asset held up, from stocks and ETFs to currencies, commodities, and indices.
Replay Major Market Events
See how prices moved from the first day of events like the 2025 Tariff Shock, the DeepSeek AI Shock, and the 2024 Yen Carry Trade Unwind.
Biggest Drop & Recovery
Instantly measure peak-to-trough max drawdown, recovery speed, and relative performance spread versus S&P 500.
Learn From Real History
Base your decisions on how markets actually behaved, not on gut feeling.